


Log in
Land Price Trends by State: What the 2026 Data Really Shows
State-level land price averages are some of the most widely quoted numbers in land investing, but they rarely tell the full story.
A single statewide average can combine very different markets. In Texas, for example, Panhandle farmland and Hill Country recreational tracts may both contribute to the same statistic despite having very different values and demand drivers.
That’s why state trends should be viewed as a starting point for research rather than a pricing guide.
They help identify where markets are changing and which states may deserve a closer look, but individual purchase decisions still depend on county-level research and comparable sales.
What The Baseline Measures
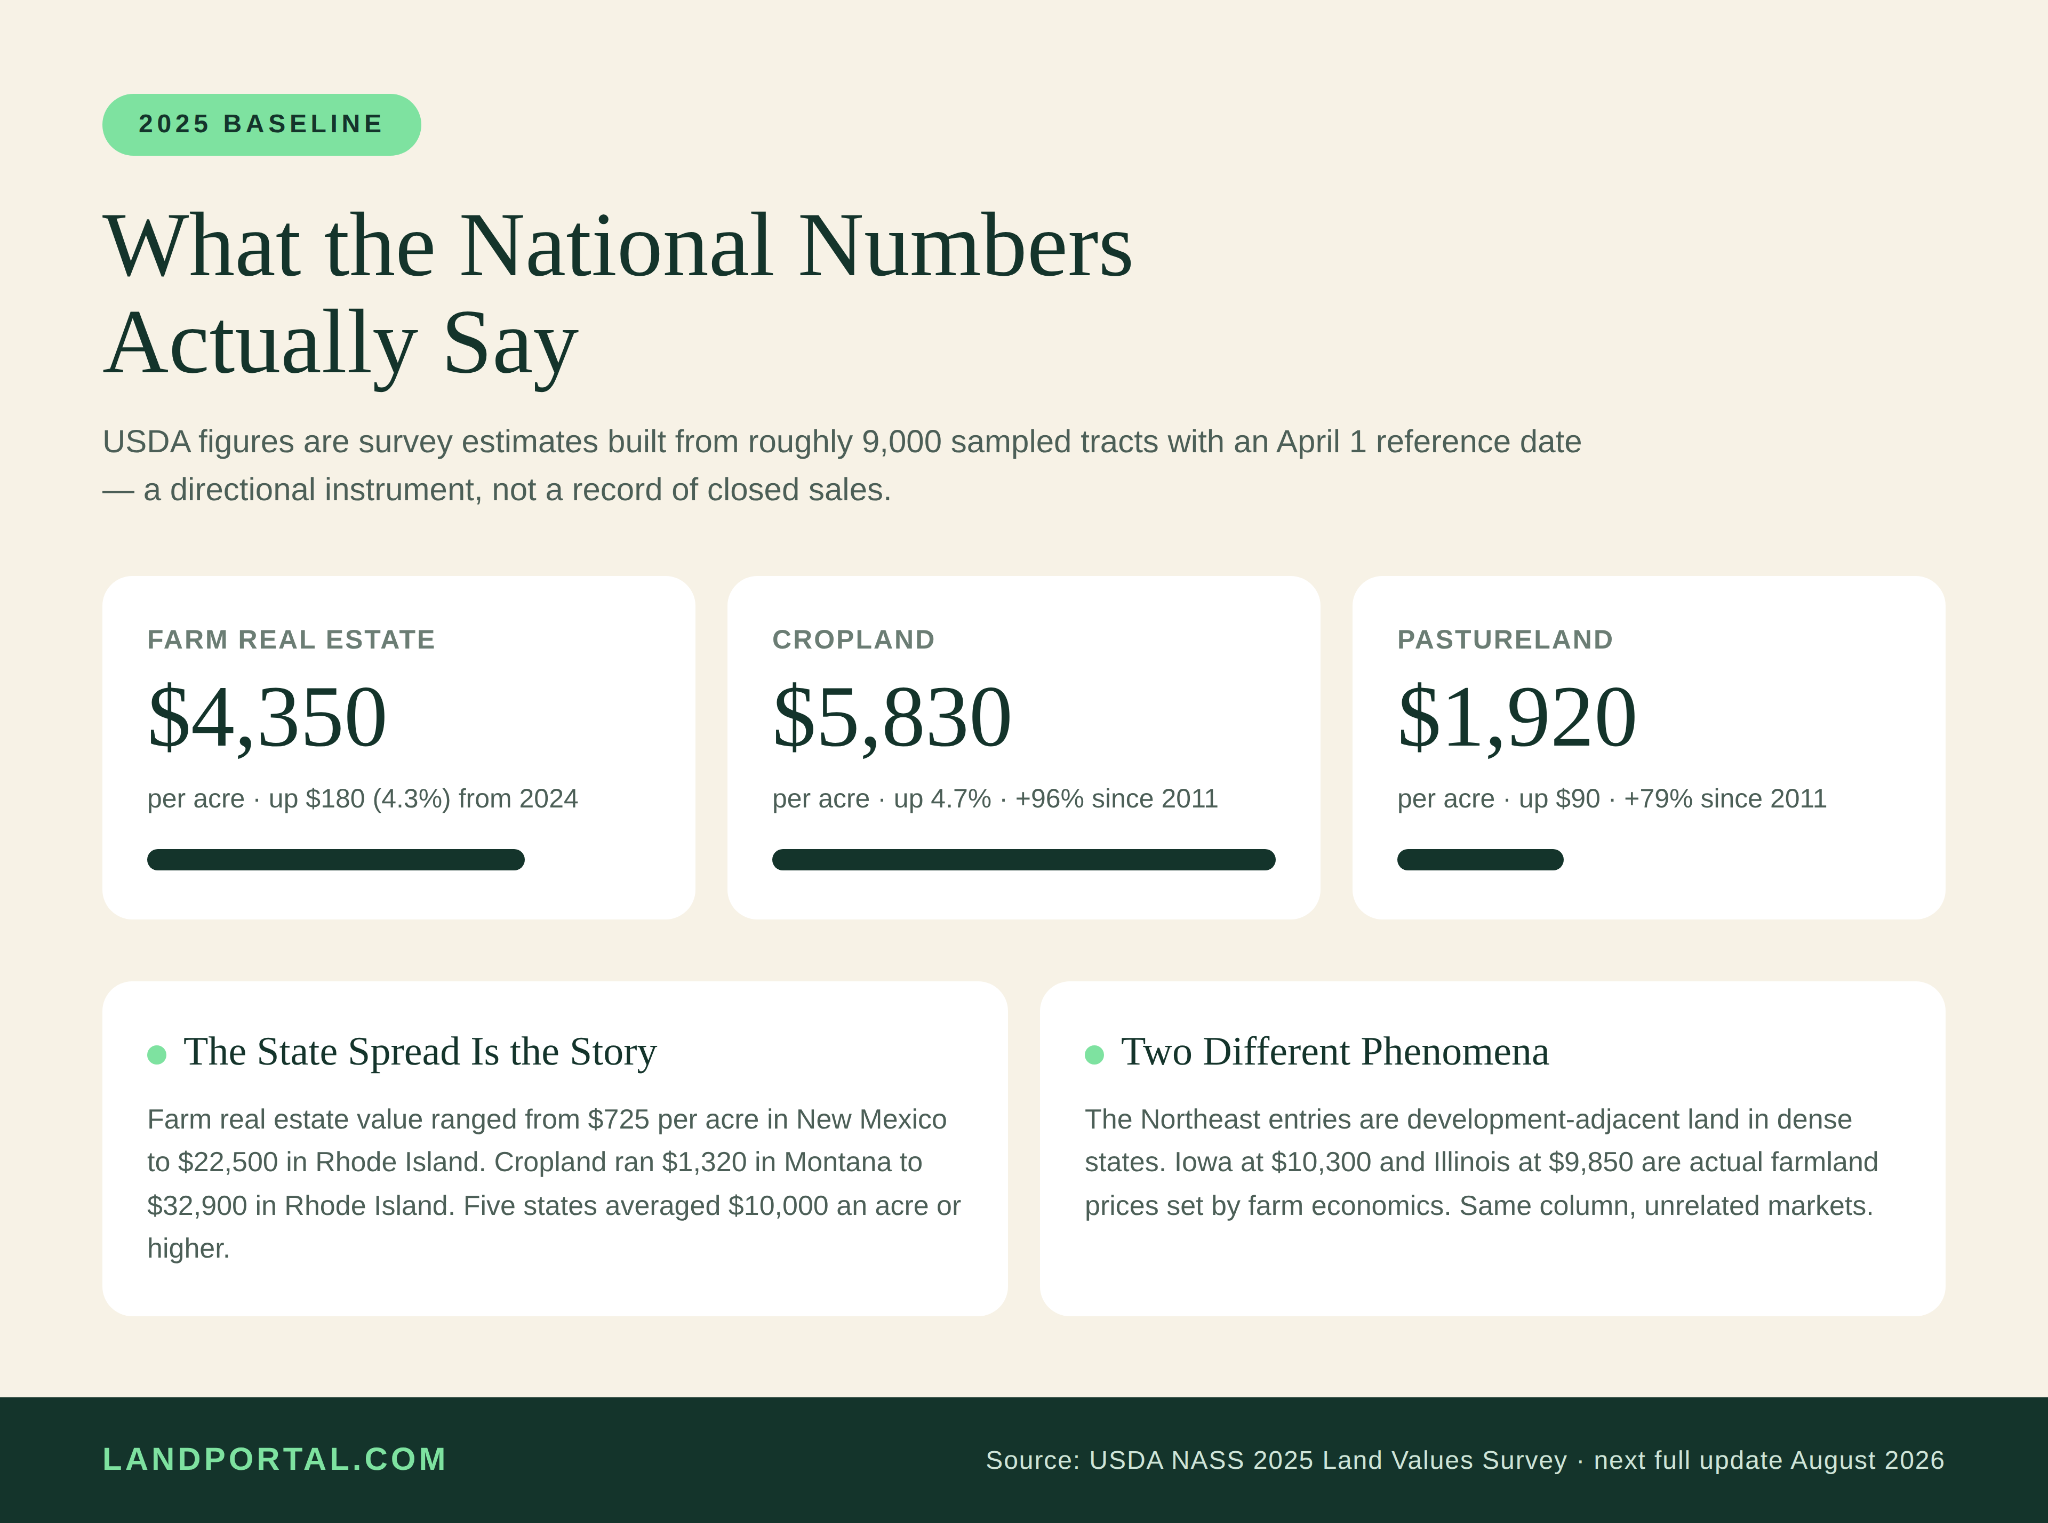
U.S. farm real estate value (all land and buildings on farms) averaged $4,350 per acre in 2025, up $180 from 2024. Cropland averaged $5,830, a 4.7% increase, while pastureland came in at $1,920.
Before using USDA land value data, it’s important to understand how it is collected.
The USDA figures are survey estimates based on roughly 9,000 sampled tracts rather than records of individual property sales. Because of that, they are best used to understand broad market trends rather than determine the value of a specific parcel.
• Farm real estate value ranged from $725 per acre in New Mexico to $22,500 in Rhode Island, with five states averaging $10,000 an acre or higher.
• The top of the cropland table runs Rhode Island at $32,900, Massachusetts at $26,000, Connecticut at $22,700, California at $17,940, and New Jersey at $16,400.
• Then a steep drop to Florida at $10,550, Iowa at $10,300, Illinois at $9,850, and Ohio at $9,750.
Notice what that ordering is really measuring. The Northeast entries are not agricultural values. They’re development-adjacent land in dense states where the highest and best use has almost nothing to do with what grows on it. Iowa and Illinois at nine and ten thousand are actual farmland prices set by actual farm economics. Same column, different phenomena.
How the Market Is Changing in 2026
The Fed district surveys move faster than the annual USDA release, and they’ve been telling a more complicated story through the first half of this year.
In the first quarter of 2026, the Chicago Fed’s Seventh District saw agricultural land values up 3% from a year ago, while “good” farmland values dipped 1% from the fourth quarter of 2025, based on responses from 104 district agricultural lenders.
Together, these figures suggest a market that may be beginning to stabilize after several years of rapid appreciation.
The state detail underneath matters more than the district number. Indiana and Wisconsin led with roughly 8% and 7% year-over-year gains, Iowa rose about 2%, and Illinois registered a 2% decline through April 1, 2026. On a quarter-over-quarter basis from January 1 to April 1, Indiana values declined 2%, Illinois dropped 1%, and Iowa and Wisconsin were unchanged.
This illustrates why it’s important to compare both year-over-year and quarter-over-quarter data when evaluating market trends. Sentiment turned with it.
In the first quarter, 56% of surveyed lenders considered farmland overvalued, and 1% considered it undervalued, though more than 80% expected values to be unchanged in the second quarter.
Only 11% of respondents saw higher demand to buy farmland versus 22% seeing lower demand, and the amount of farmland offered, the number of farms sold, and acreage traded were all down. District cash rents fell 3% in 2026, the second consecutive annual decline.
Falling cash rents alongside relatively stable land values may indicate changing market conditions that investors should continue monitoring over the coming quarters.
The most striking divergence in the current data isn’t between states. It’s between what the land produces.
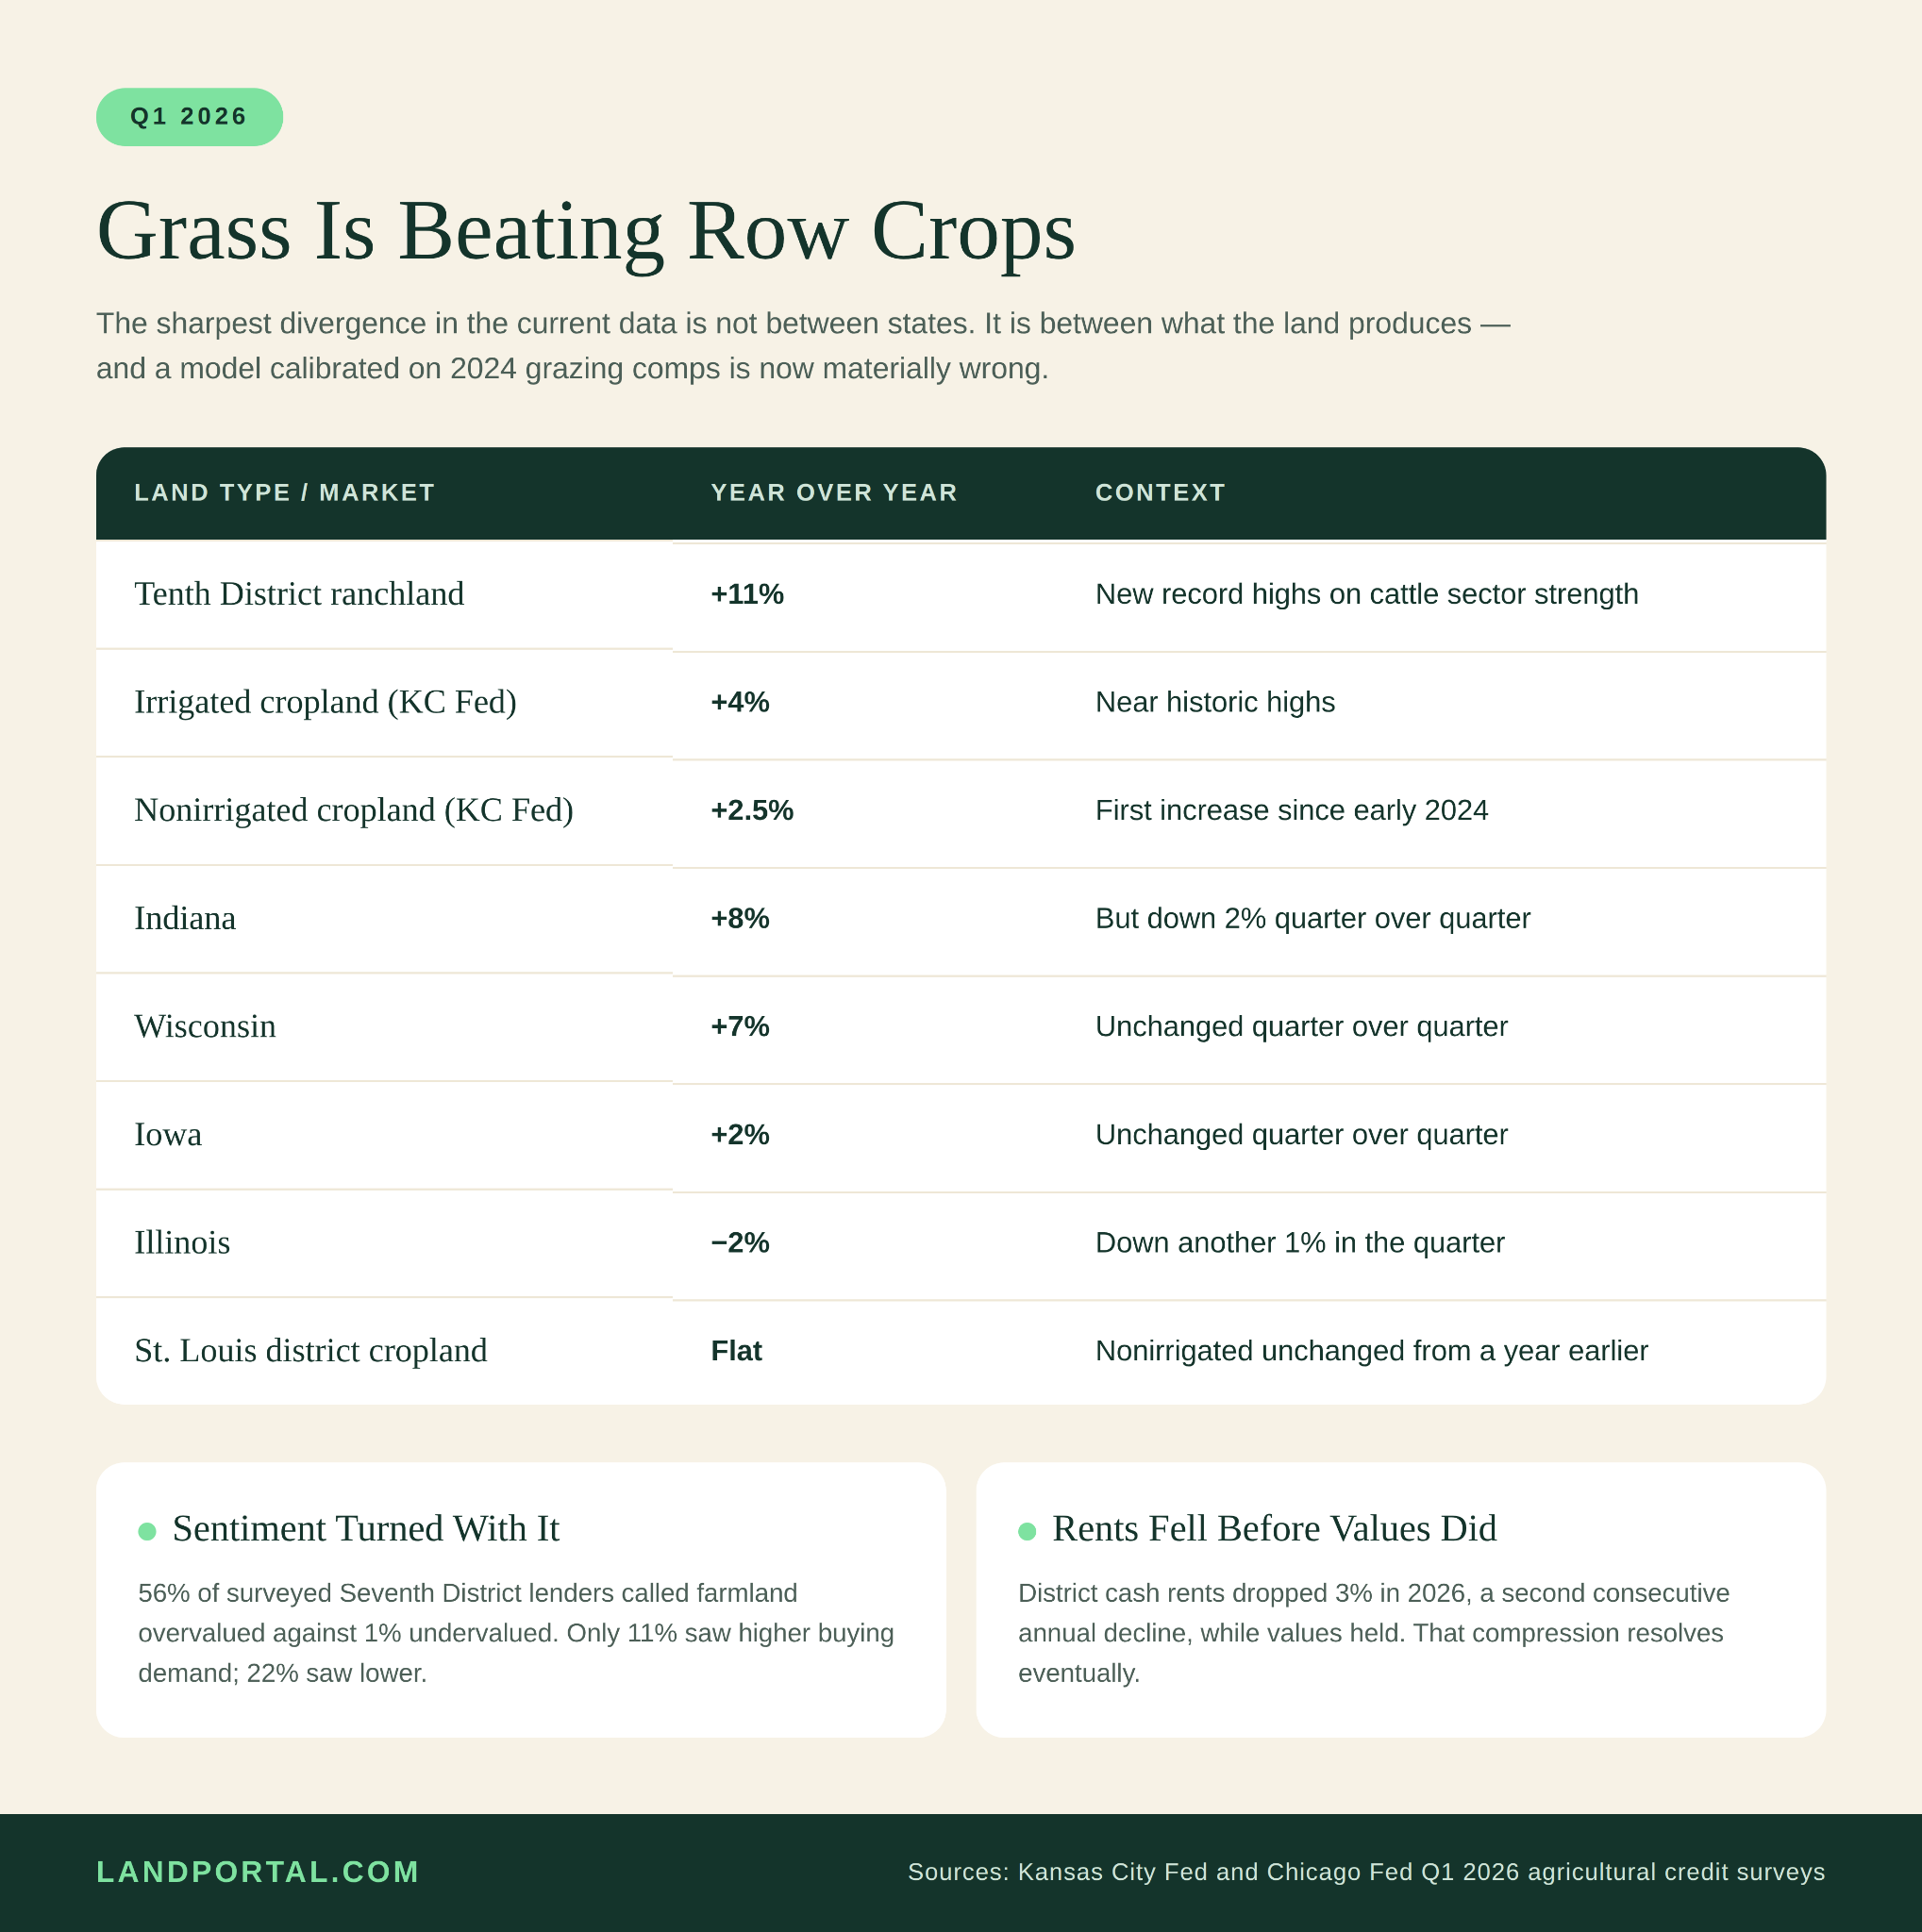
Ranchland values in the Kansas City Fed’s Tenth District rose nearly 11% from a year ago in the first quarter of 2026 and reached new record highs, driven by ongoing strength in the cattle sector, while cropland values increased modestly for the first time since early 2024.
Non-irrigated cropland rose about 2.5% and irrigated cropland about 4%.
Compare that to the same district a year earlier: in the first quarter of 2025, nonirrigated farmland was about 2% below the prior year, irrigated land declined about 4%, and ranchland was up roughly 1%.
An eleven-point swing in ranchland values over twelve months highlights how quickly agricultural markets can change. Investors relying on older comparable sales should review current market conditions before pricing ranch properties.
The pasture data from USDA points the same way: the change in pasture value by state ranged from a 1.3% increase in New Jersey to 8.6% in North Dakota, with the Northern Plains region posting the highest regional increase at 7.6%.
Regional Splits Worth Knowing
Across participating Fed districts, nonirrigated cropland values were up an average of about 3% in the first quarter of 2026, remaining near record highs despite challenges in the crop sector. The dispersion around that average is the whole point.
Cropland values rose more than 5% in northern Indiana, Kansas, and Texas, while values declined about 4% in South Dakota.
Non-irrigated cropland in the St. Louis district, Arkansas, plus parts of Missouri, Illinois, Indiana, Kentucky, Mississippi, and Tennessee, was unchanged from a year earlier.
South Dakota down four while Kansas is up five. Both are Plains states. Both grow row crops. The difference is basis, local cattle exposure, and which lenders are writing paper.
By region, the Southern Plains posted the highest increase in farm real estate value at 5.9%.
Why Texas Deserves a Closer Look
The Texas Real Estate Research Center tracks verified rural transactions rather than survey estimates, which makes it one of the better state-level datasets in the country for anyone buying actual parcels.
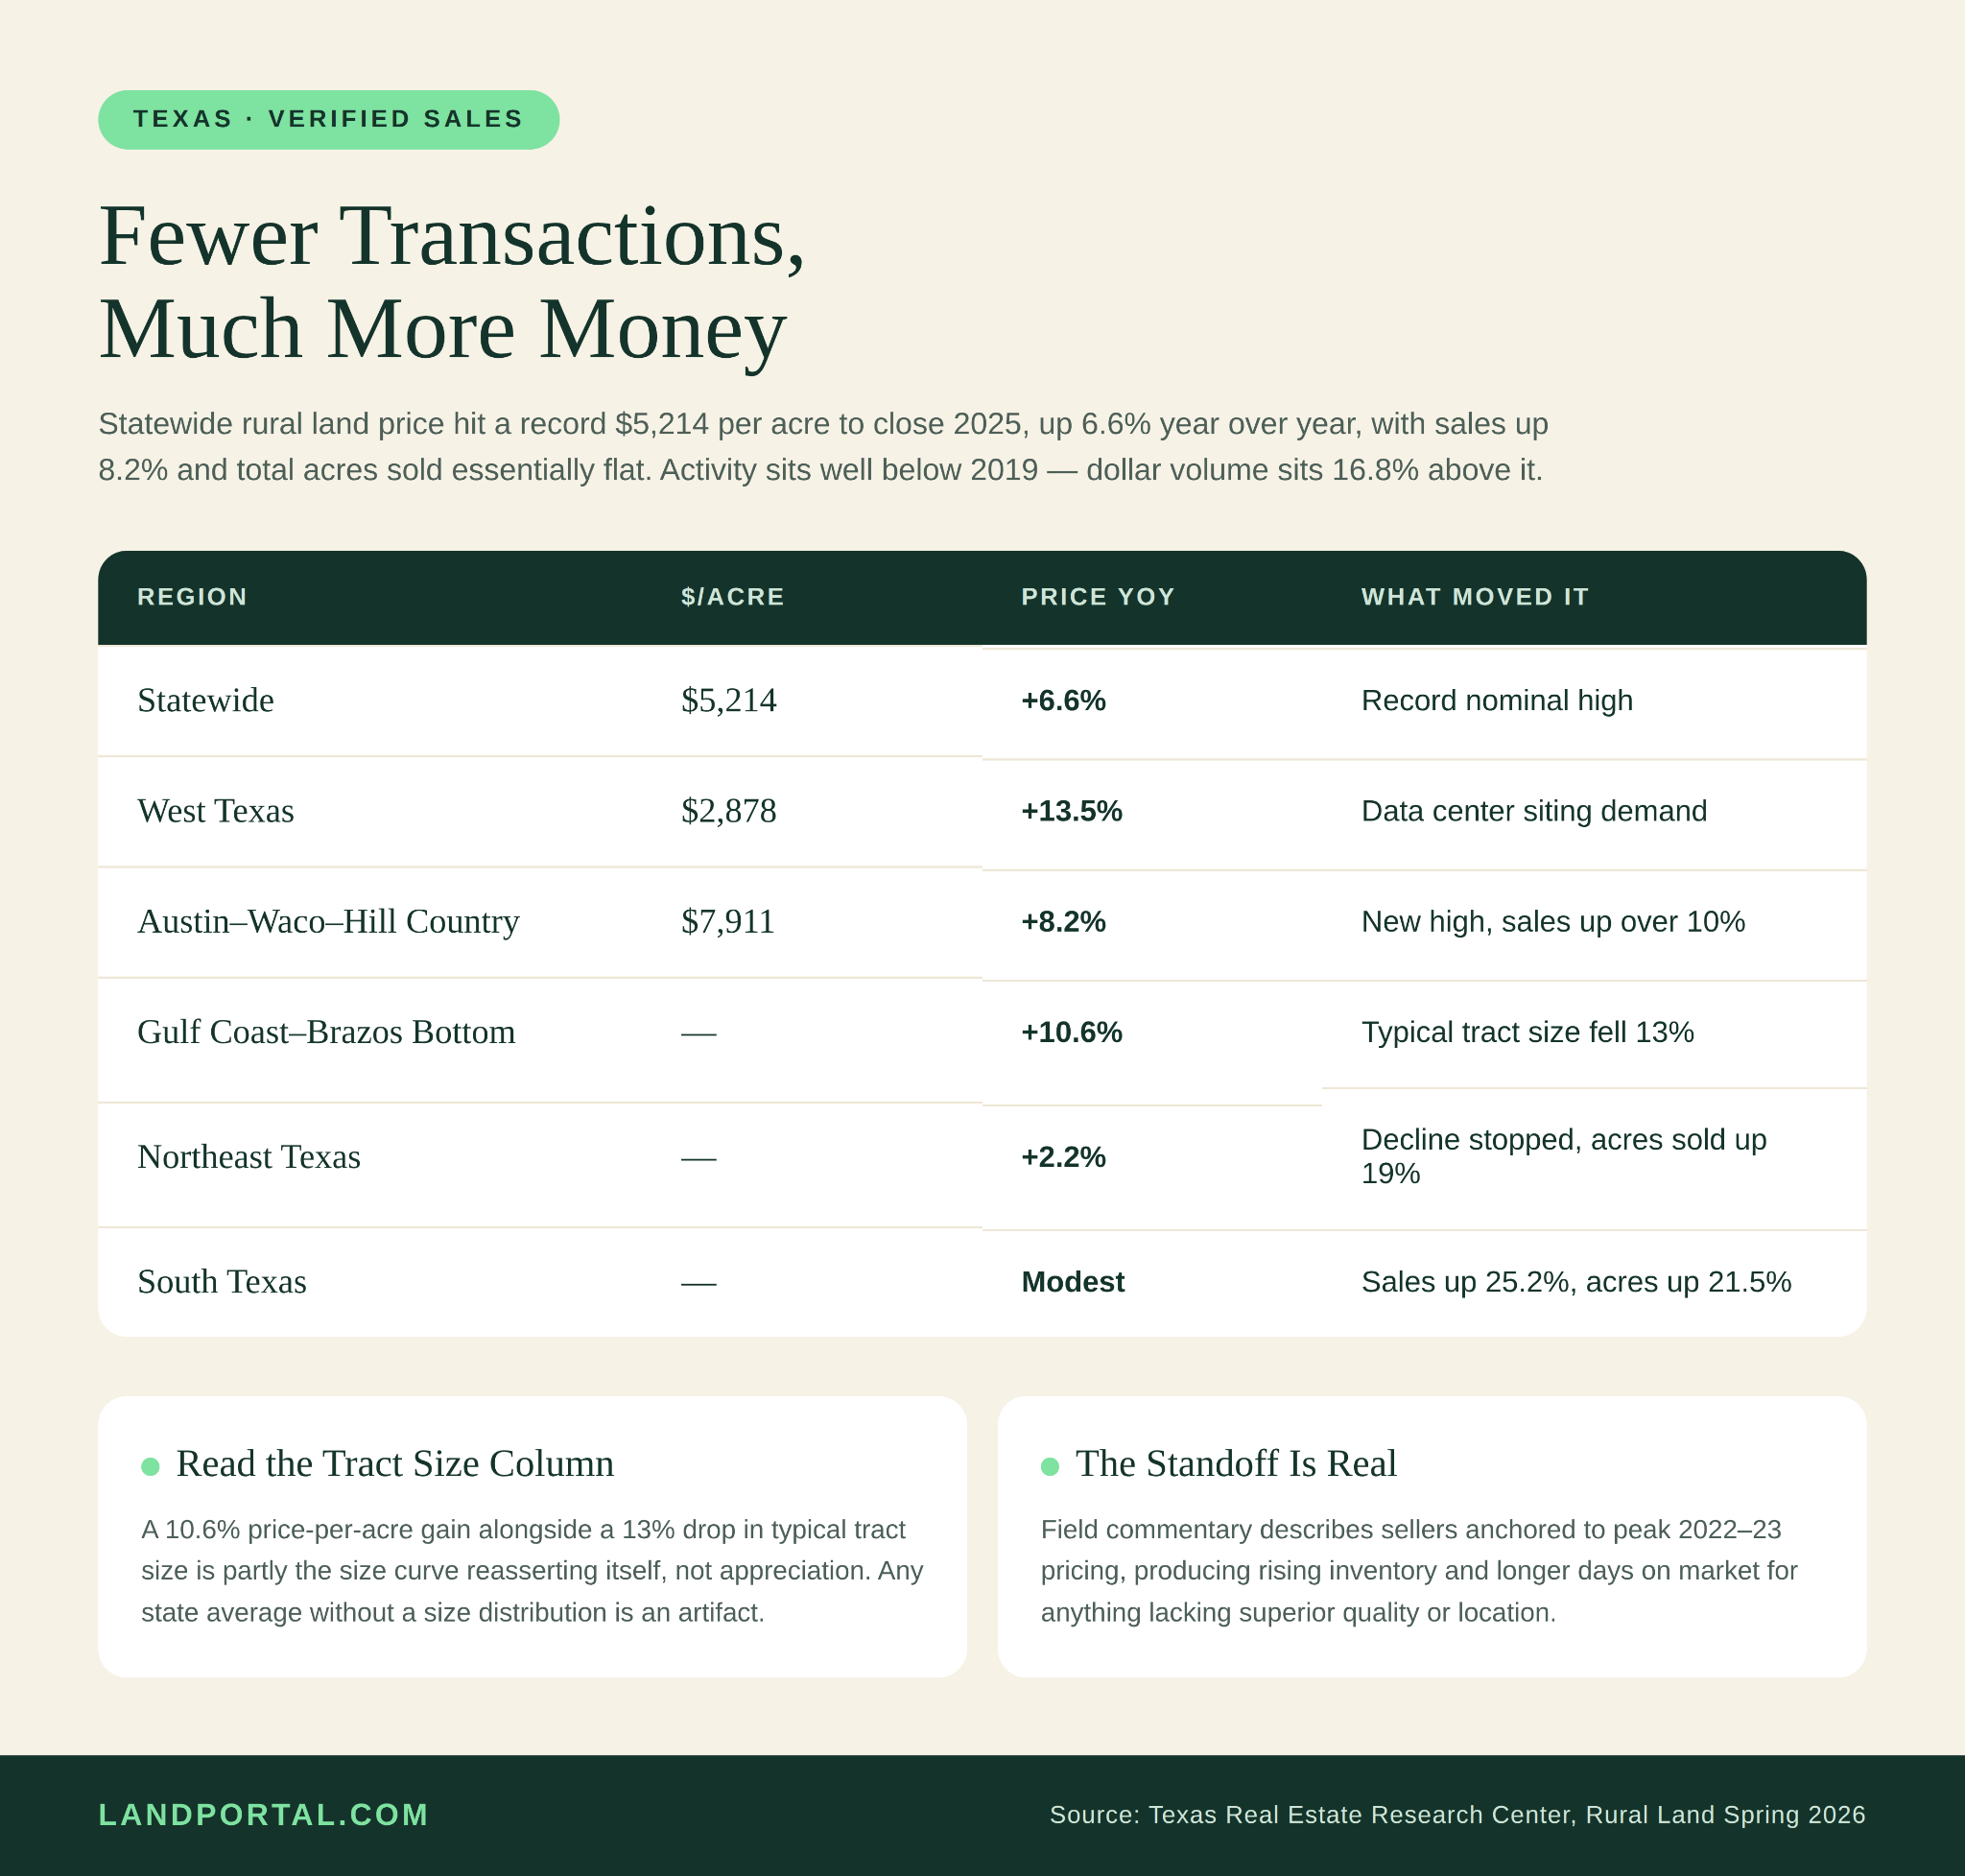
Statewide nominal price reached a record $5,214 per acre at the end of 2025, a 6.6% increase year over year, reinforced by an 8.2% increase in the number of sales, the strongest quarterly growth since late 2021.
Total acres sold were nearly flat, down 0.3%, while total dollar volume expanded 6.2%. Market activity remains well below 2019 levels, but total dollar volume sits 16.8% above 2019.
While the number of acres sold remained relatively flat, total dollar volume increased. That suggests rising prices rather than a significant increase in overall demand.
Regionally: West Texas jumped 13.5% to a record $2,878 per acre, influenced partly by a spike in demand for land with data center potential. The Austin–Waco–Hill Country region rose 8.15% to a new high of $7,911 per acre, with sales up over 10%. South Texas saw sales up 25.2% and acres sold up 21.5%. Gulf Coast–Brazos Bottom prices rose 10.6%, though typical tract size fell 13%, which is part of the explanation. Northeast Texas stopped declining, with price up 2.2% and a 19% increase in total acres sold.
That Gulf Coast figure is a lesson in itself. A 10.6% price-per-acre increase accompanied by a 13% drop in tract size is at least partly the size curve reasserting itself, not appreciation. Smaller parcels trade higher per acre. A regional average that shifts toward smaller tracts will print a gain even in a flat market.
This is why changes in average tract size should always be considered when interpreting statewide land price data.
The Center’s 2026 forecast calls for small statewide price increases and a slight decline in acres sold, with continued regional divergence, localized exuberance in areas tied to energy and AI infrastructure, and sideways trading in traditional agricultural regions like the Panhandle where high prices are meeting buyer resistance.
Field commentary described a standoff, with sellers anchored to peak 2022–23 pricing producing longer days on market for anything lacking superior quality or location.
What Drives Land Prices by State
Several factors influence statewide land values, and they often affect markets at different times.
Commodity income sets the floor across the farm belt, and it’s under pressure. USDA projections indicate net farm income may decline 2.6%, about $4 billion, in 2026 versus last year, with government payments expected to contribute $42 billion and lower revenues projected for crops, dairy, and poultry.
An Iowa lender in the Chicago Fed survey described cash flow projections at or below breakeven for many 2026 operations, with borrowers drawing down working capital to cover shortfalls.
Credit conditions are the transmission mechanism. Demand for non-real-estate farm loans was up for the tenth consecutive quarter in early 2026, while availability of funds for agricultural lending was down for the twelfth consecutive quarter.
Extended tightening in agricultural lending conditions can eventually affect both buyer demand and land values.
Migration and remote work reprice small acreage on a slower clock and largely independent of any of the above. The five-to-twenty-acre homesite market answers to household formation and drive time to a town with a hospital.
Small recreational and residential acreage often follows different market dynamics than larger agricultural properties, even within the same state.
Water is the force that resets the math permanently rather than cyclically. Groundwater regulation, aquifer depletion, and adjudication in the West are separating irrigated and non-irrigated ground into distinct asset classes, visible in the fact that the Fed surveys report them as separate line items with different signs.
And then there’s the newest one, showing up unevenly and enormously: utility-scale solar, wind, and now data center siting. West Texas at +13.5% is the clearest current example of a load-driven repricing that has nothing to do with agriculture and everything to do with proximity to transmission.
Asking the Data Directly
Comparing multiple counties across several states can require reviewing a large amount of market data.
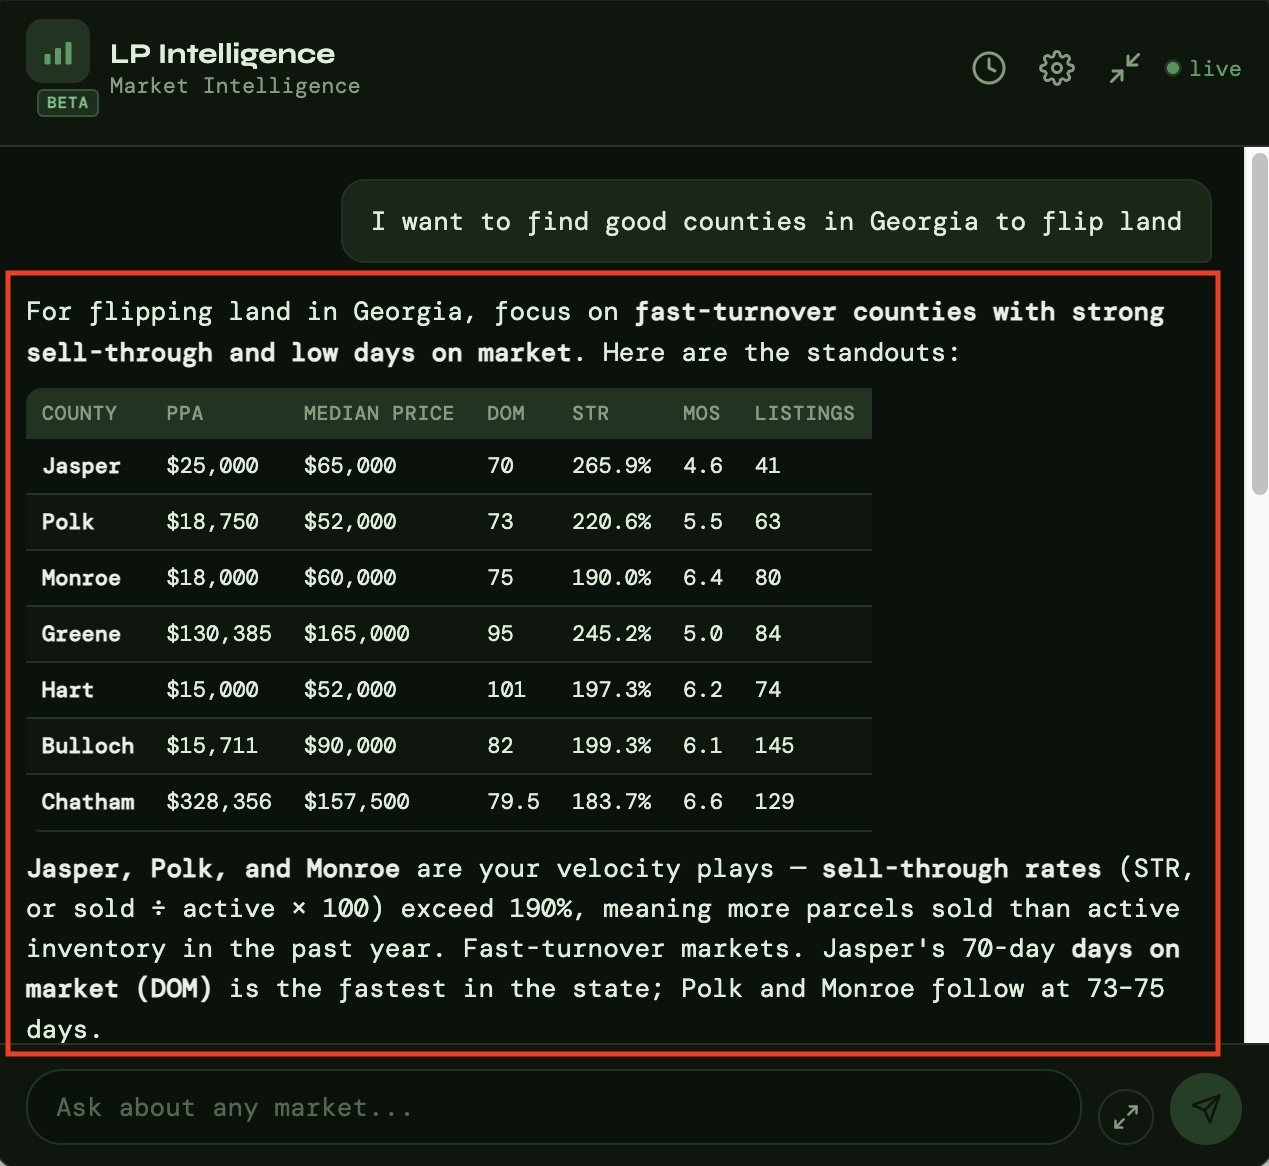
LP Intelligence allows investors to ask questions about market trends, comparable sales, parcel information, ownership records, and county-level activity using the same research data already available inside Land Portal.
Instead of manually searching through reports and dashboards, investors can ask questions in natural language to compare markets, identify trends, and organize research more efficiently.
This can be especially helpful when evaluating several markets before deciding where to focus acquisition efforts.
The full framework for how experienced operators make that call runs through land investing education, and the research, comping, mapping, filtering, and export tooling behind it lives in Land Portal.
Two Numbers to Interpret Carefully
First: any state average not paired with a tract size distribution. A shift in the mix produces movement that looks like appreciation and isn’t, which is exactly what the Gulf Coast–Brazos Bottom figure demonstrates.
Second: any figure whose vintage isn’t stated. The USDA survey references April 1 and publishes in August, which means the state-level numbers circulating right now describe conditions from over a year ago, during a period when the Fed surveys show the direction changed at least twice.
The next full state-level update lands in August.
Between now and then, the Quarterly Federal Reserve lender surveys provide additional insight between annual USDA updates and can help investors understand changing market conditions before new statewide data becomes available.
Your Premium Source For Real Estate Data
© Copyright 2026 Land Portal – All Rights Reserved